Monthly Archives: February 2016

Day 102: On Our Way!

Flying to Orlando for the TI 2016 International Conference today. Excited to reconnect with friends and ideas!  I know I’ve said it before, but I think this is an awesome conference for keeping current with trending strategies and theories. #teachercandy  #tilearns2016  View from our hotel room

20160224_182949

Day 101: Logs in Life Peer Review

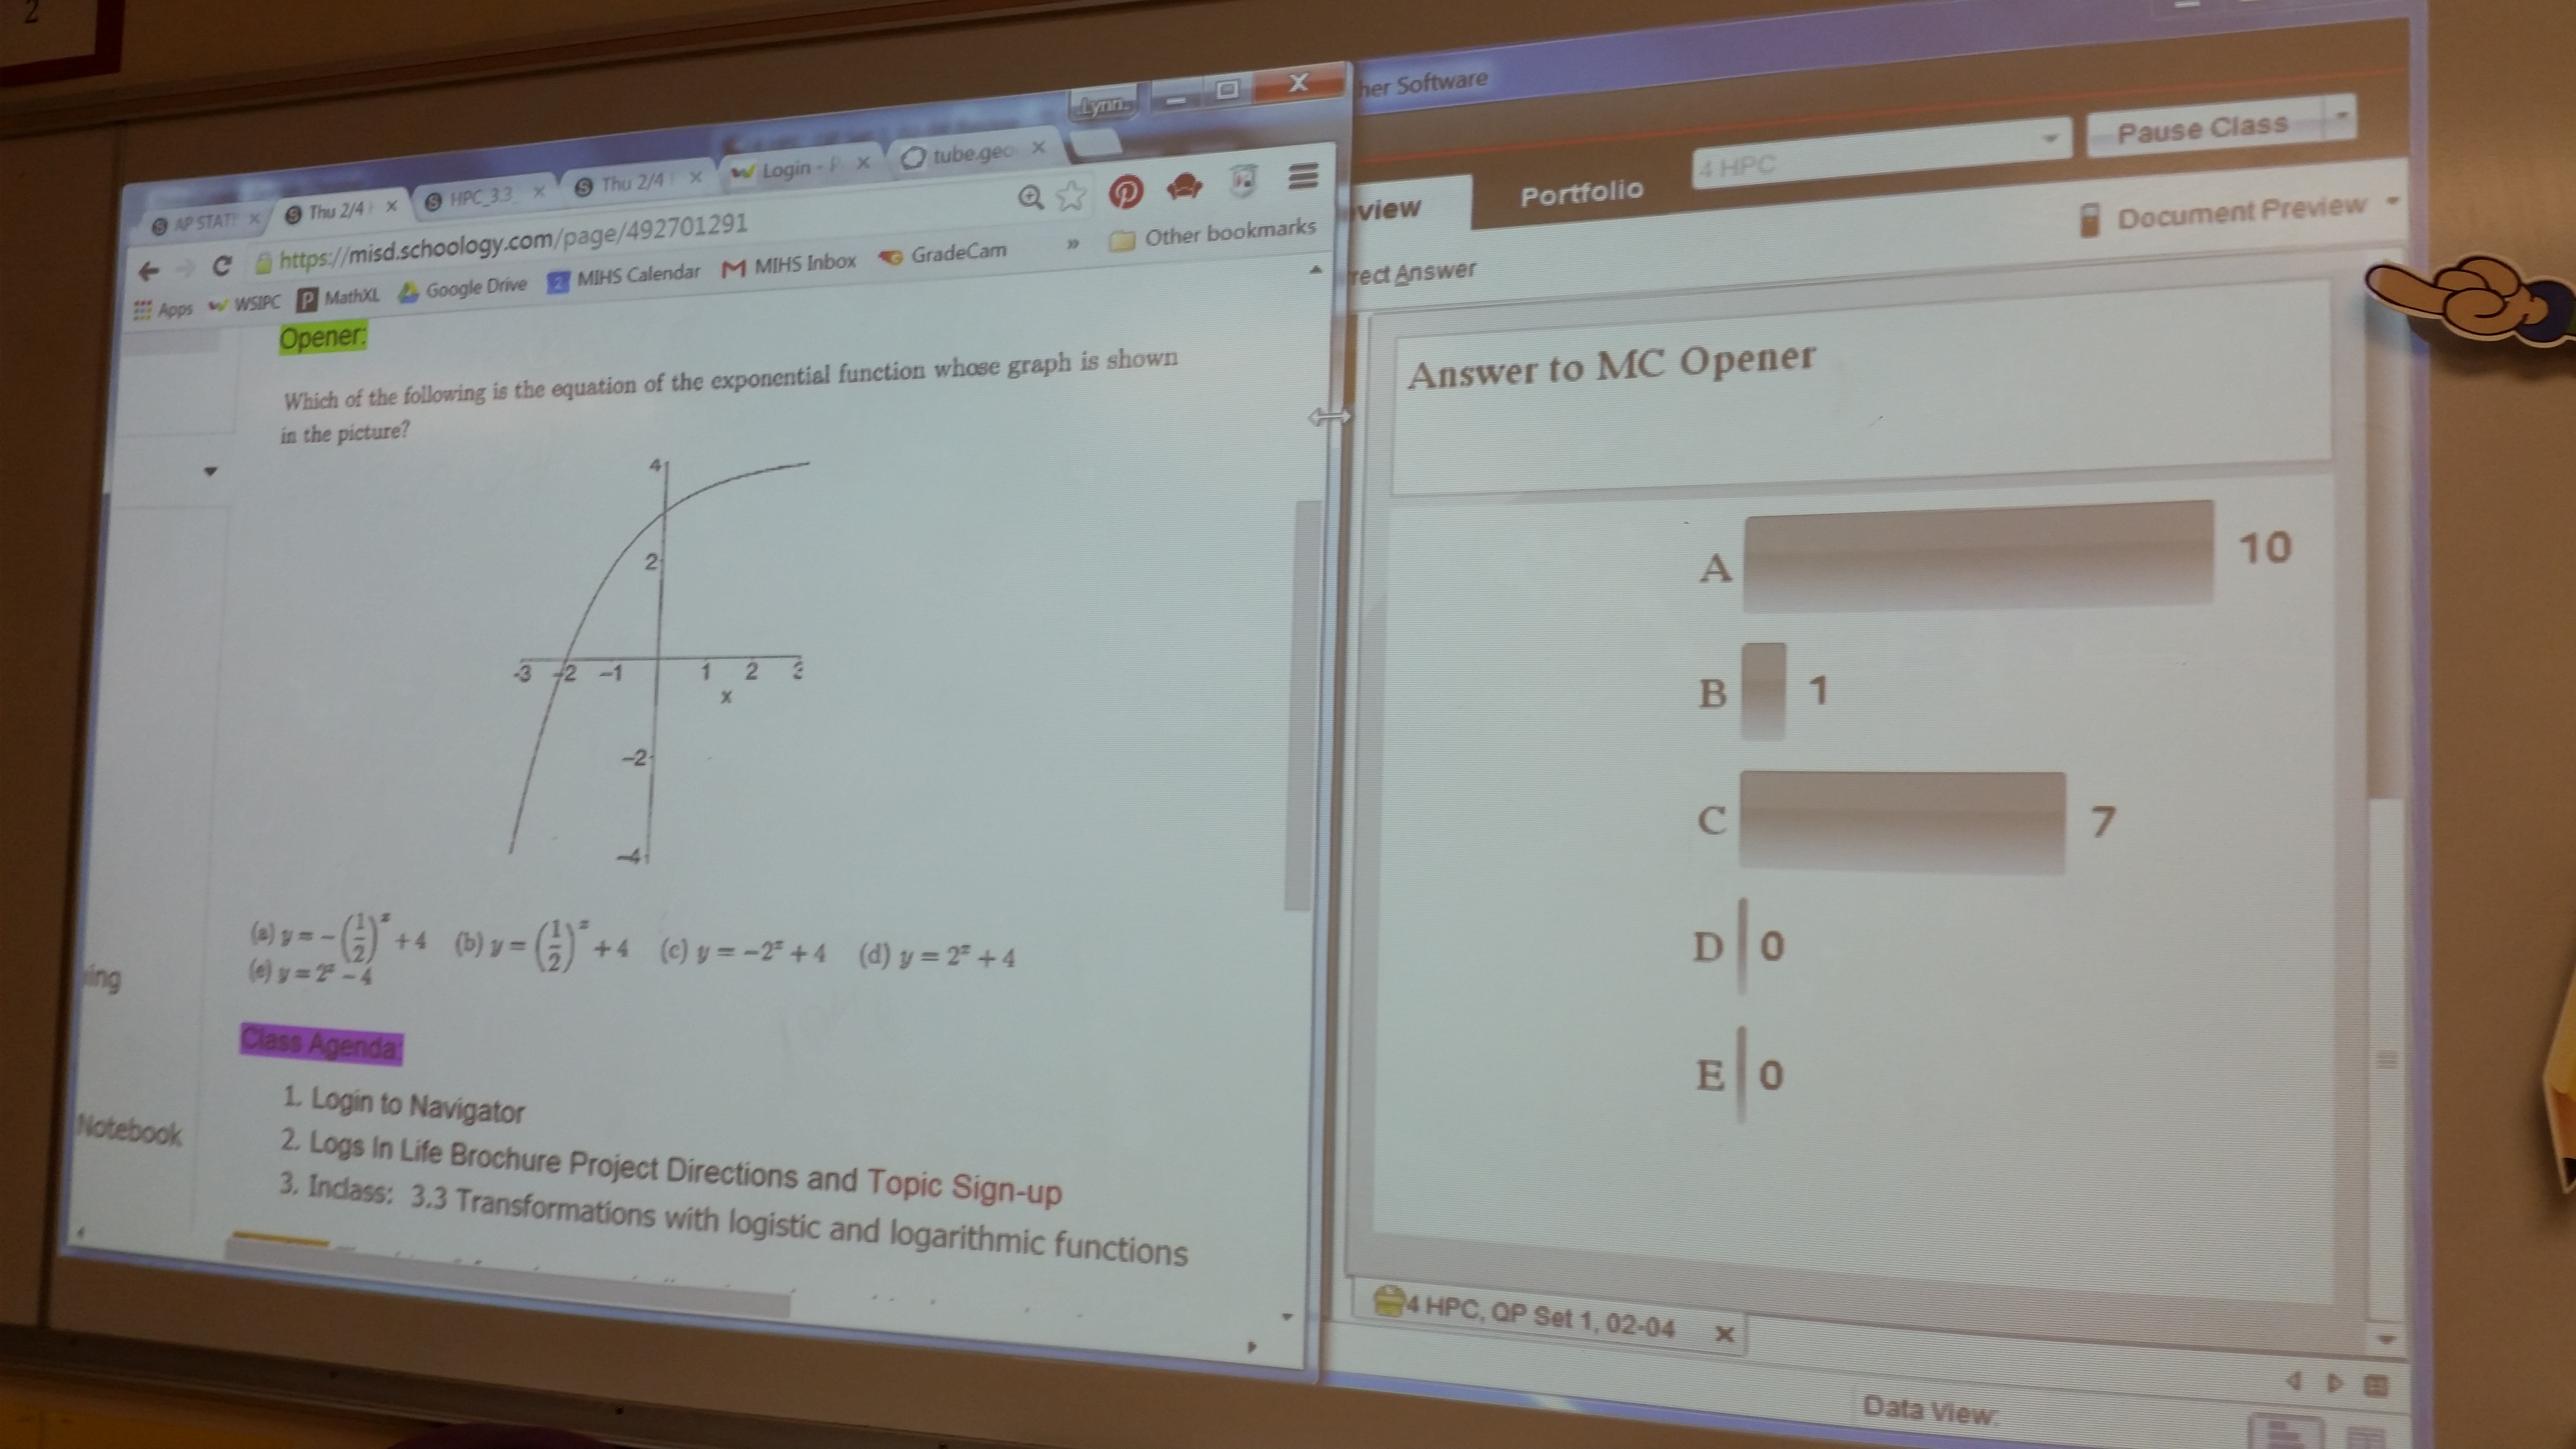
My precalculus students completed a project on logs and logistics function in real world. I borrowed this activity from one of my creative and thoughtful colleagues at school. Before break, they signed up for a topic where logs or logistic functions are used. I asked them to find a topic that was interesting to them and then see if log or logistic functions play a part in the topic. They used their iPads to do a Google search on their topic.

Students signed up for two possible topics and referenced them with an online site, which they submitted through a Google Form. Since Google Forms are time stamped, I able to use a first come, first served approach to topic assignment. I allowed up to 3 people to select the same topic, but after that, they got their second choice. Out of two classes, I only had 4 students that needed to determine a new topic.

20160222_173448

Here is a brief synopsis of what was required:

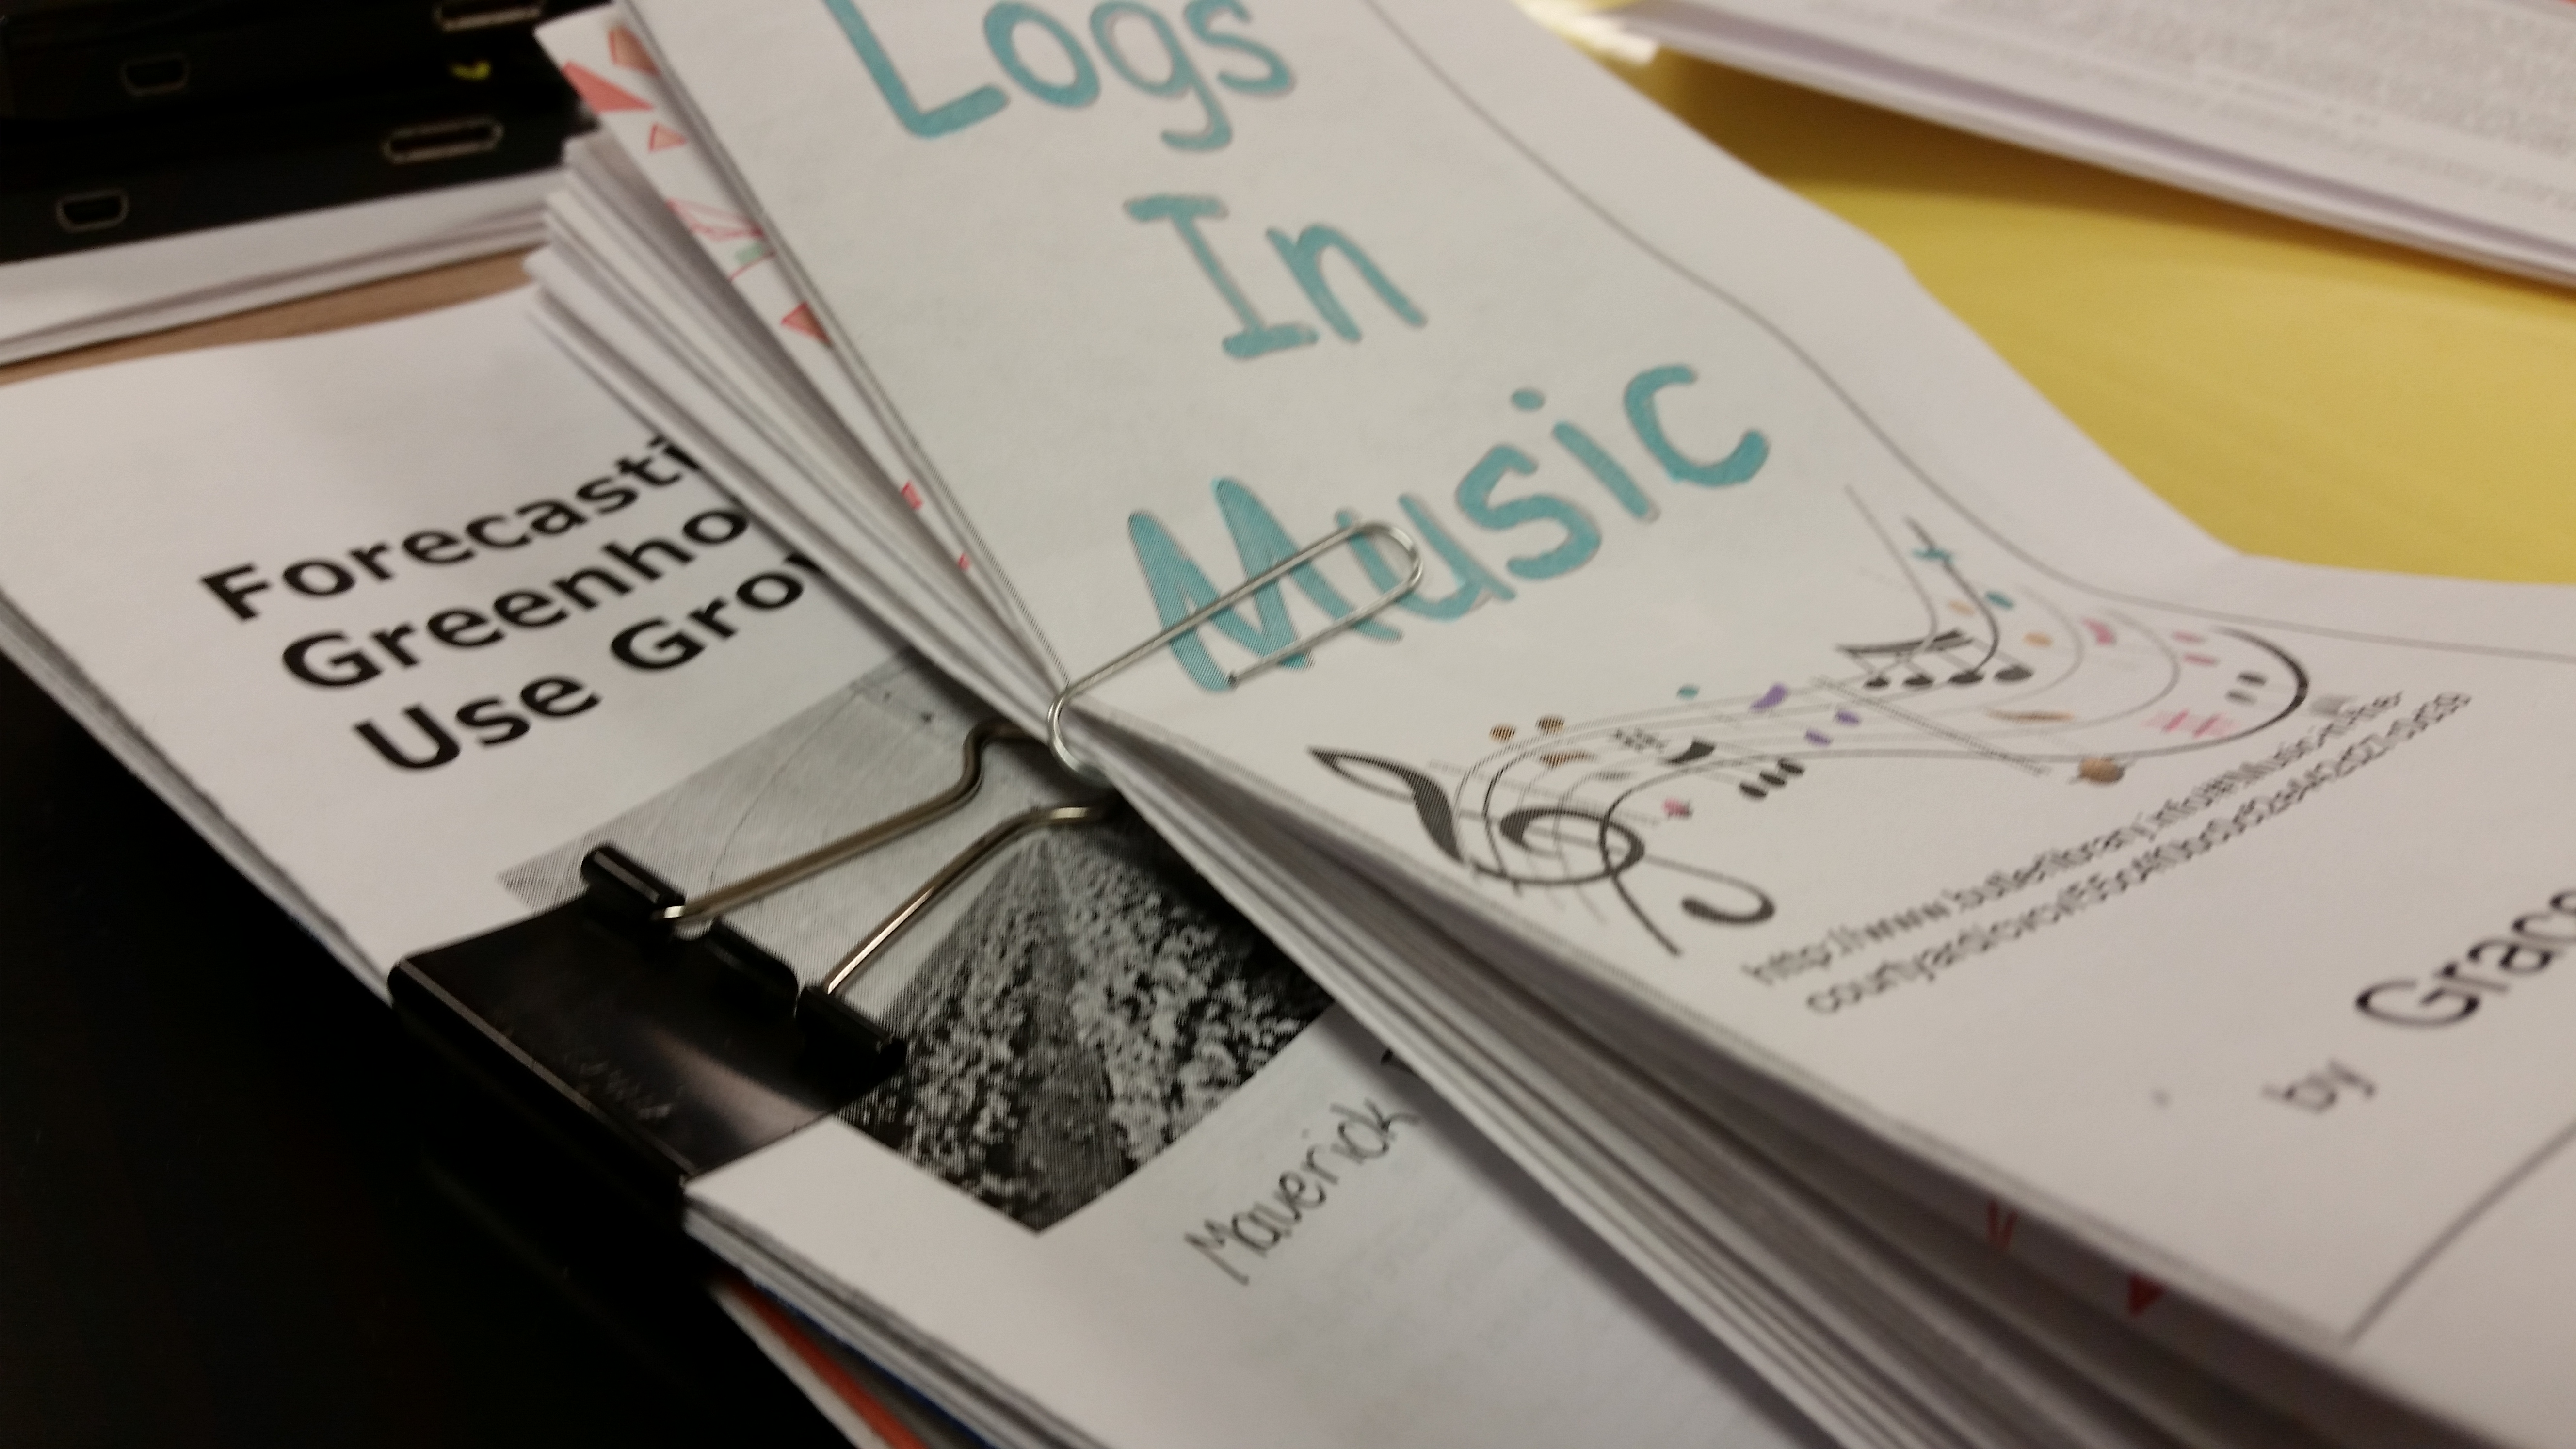
THE TASK: The end product of your webquest will be a BROCHURE describing what you have learned about your chosen application of logarithms. • Brochure style (tri-folded) • Typed in your own words • Description and history of the application (e.g. “what is a decibel?” and “who invented the Richter scale?”) • Description of mathematics used in calculations – specifically logarithms with an example • Description of at least one career in which this application is used • At least one relevant graphic Citation of other websites used beyond the ones given (just list the url)

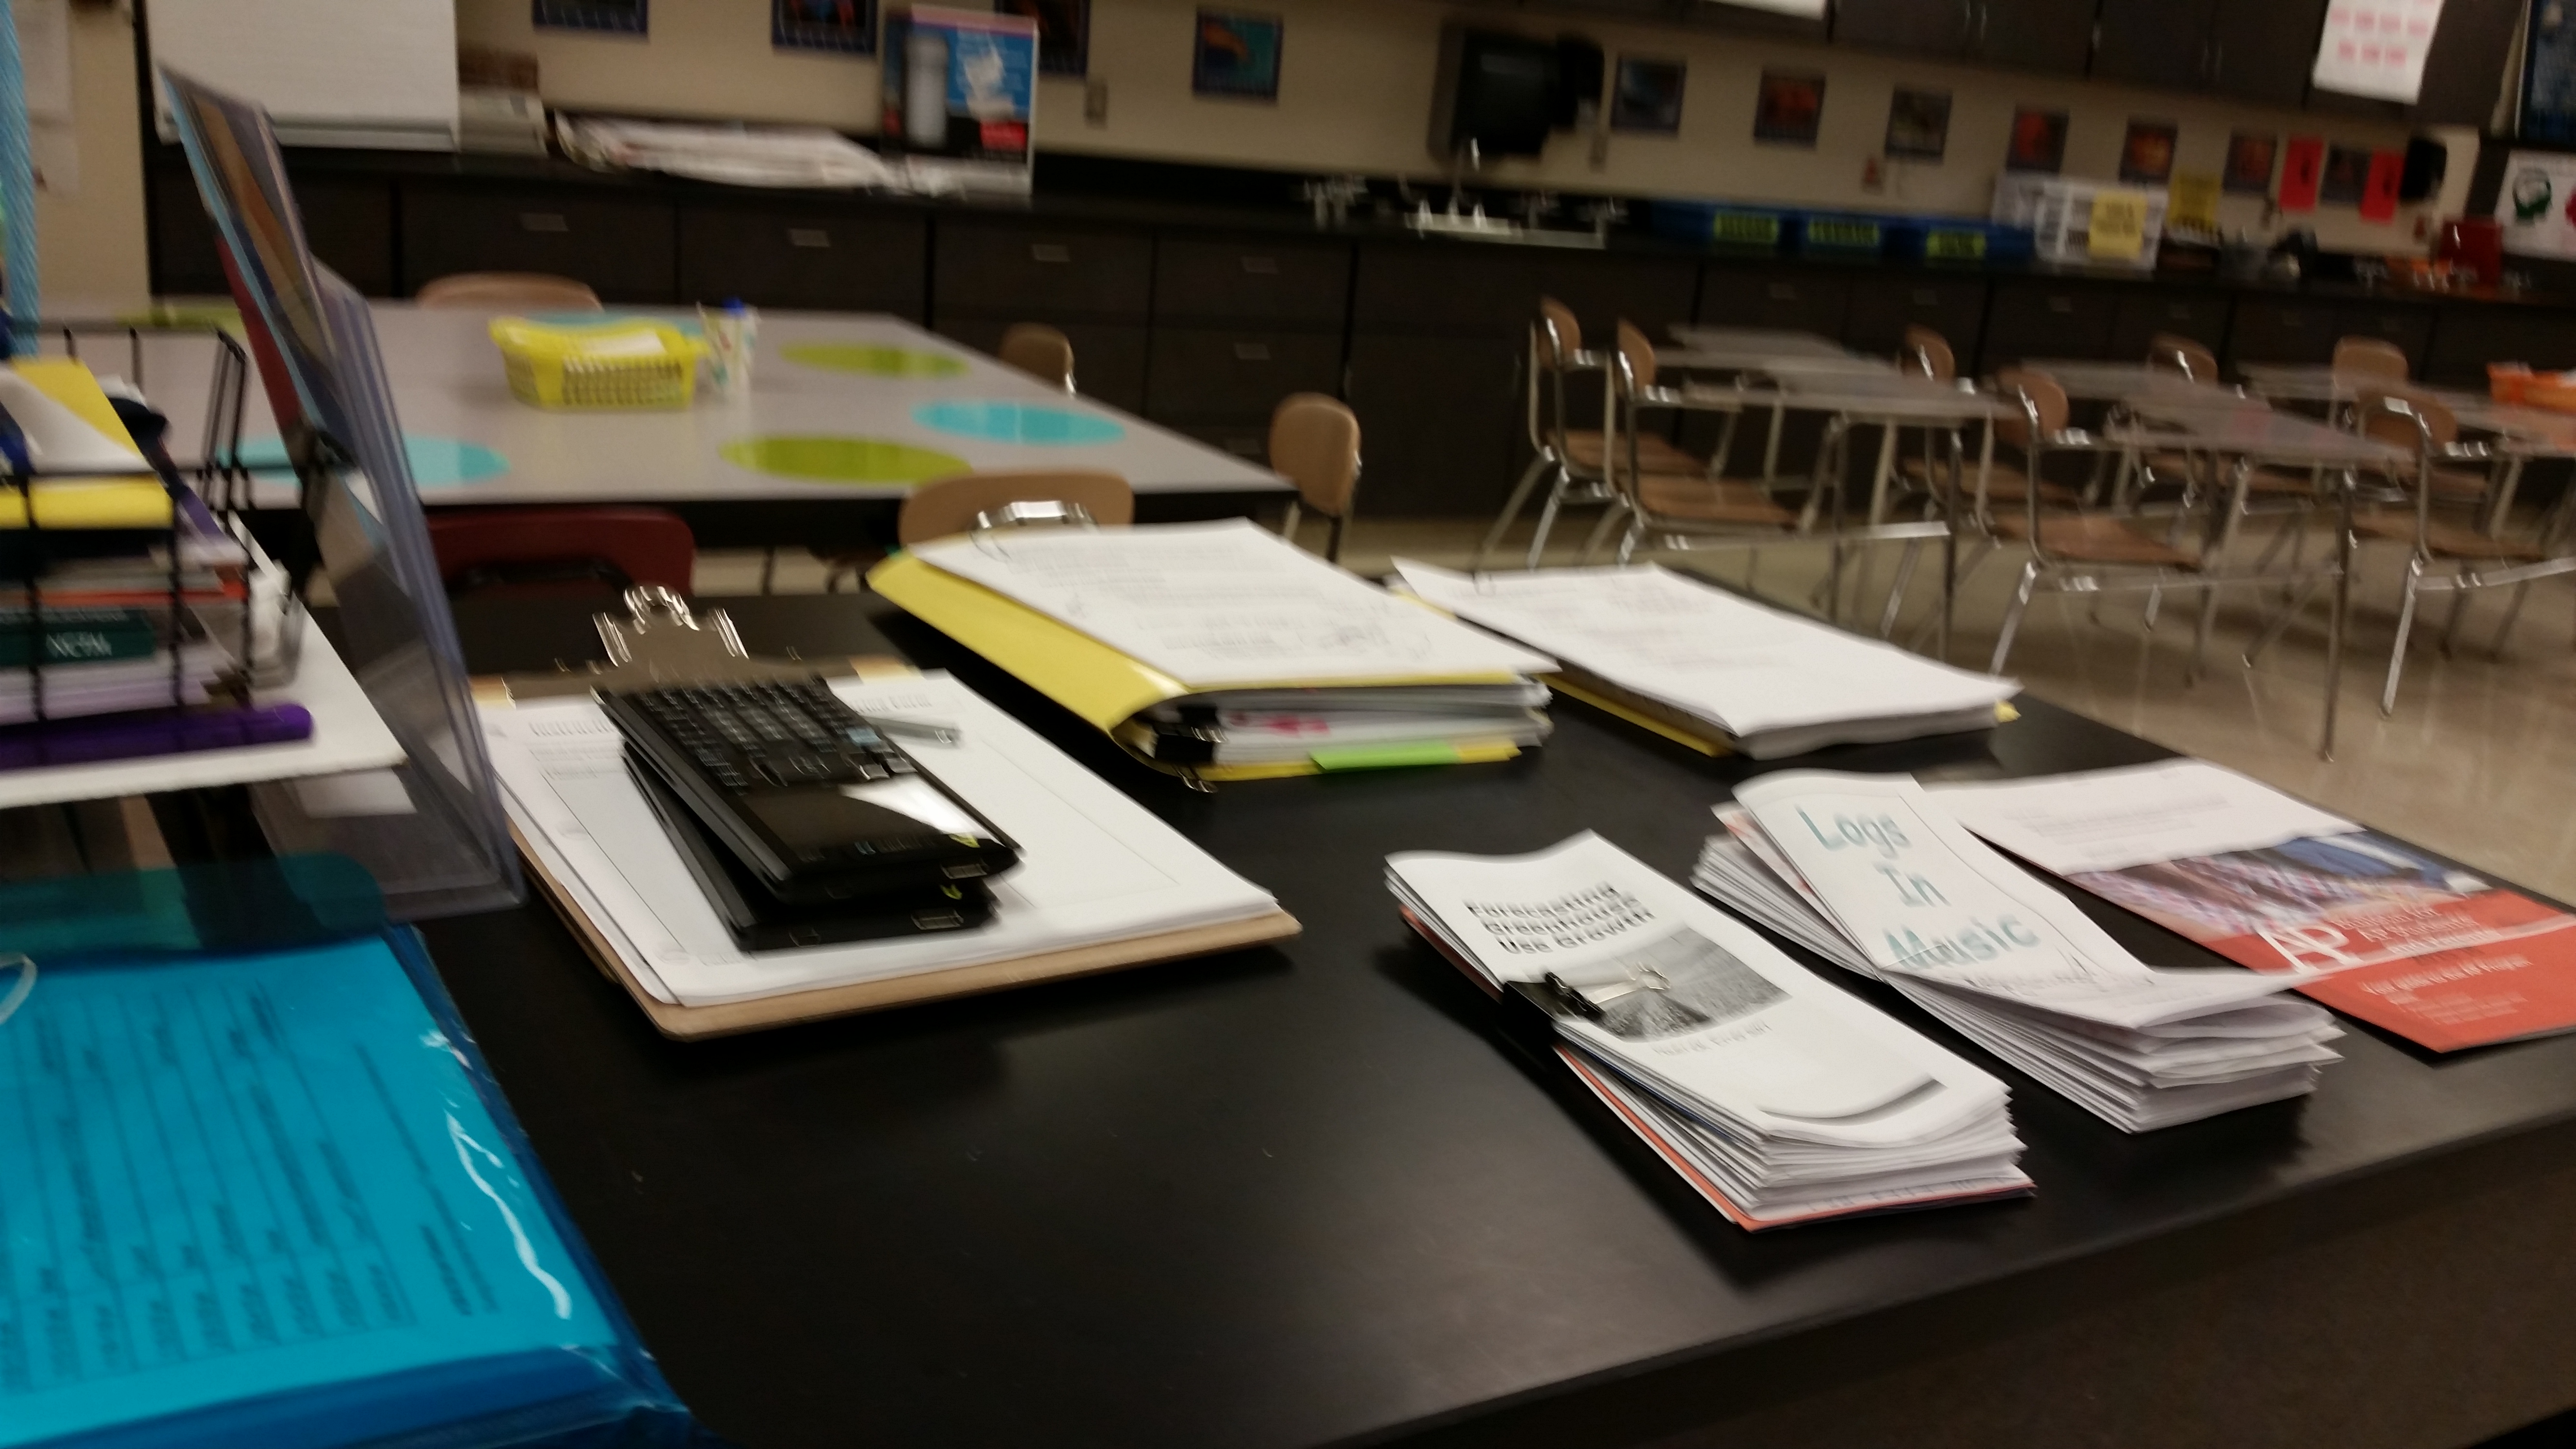
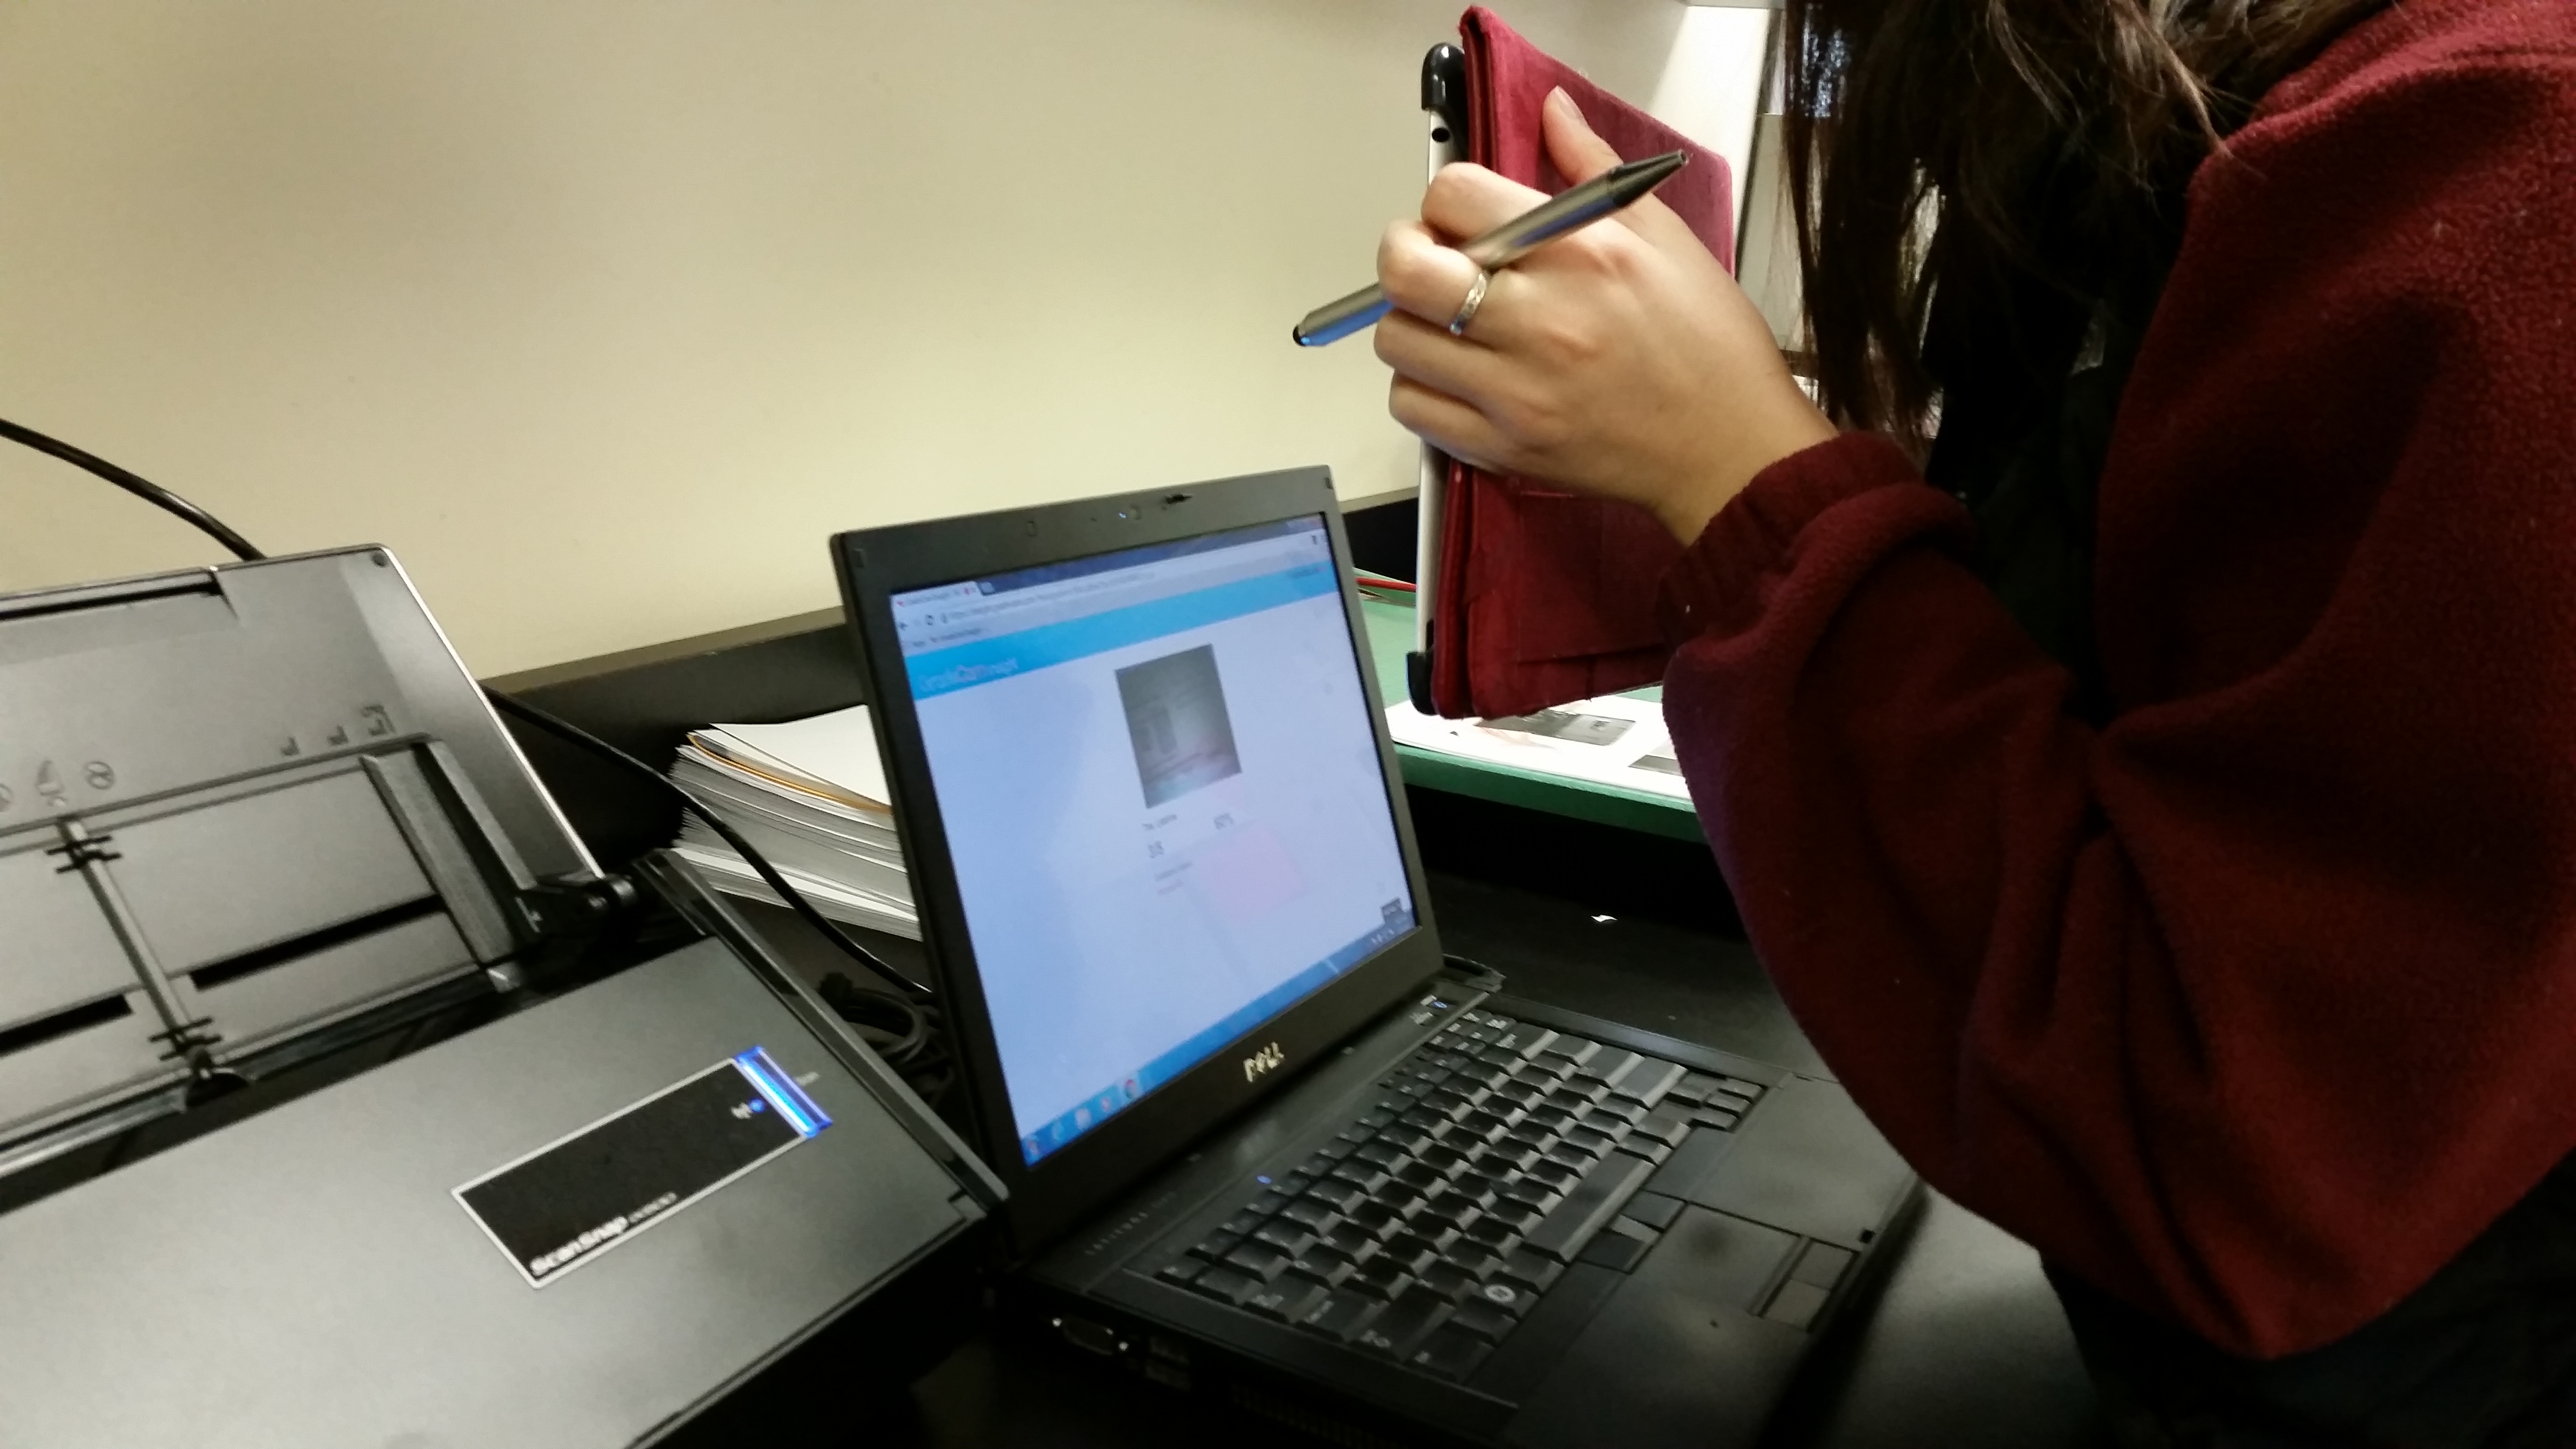
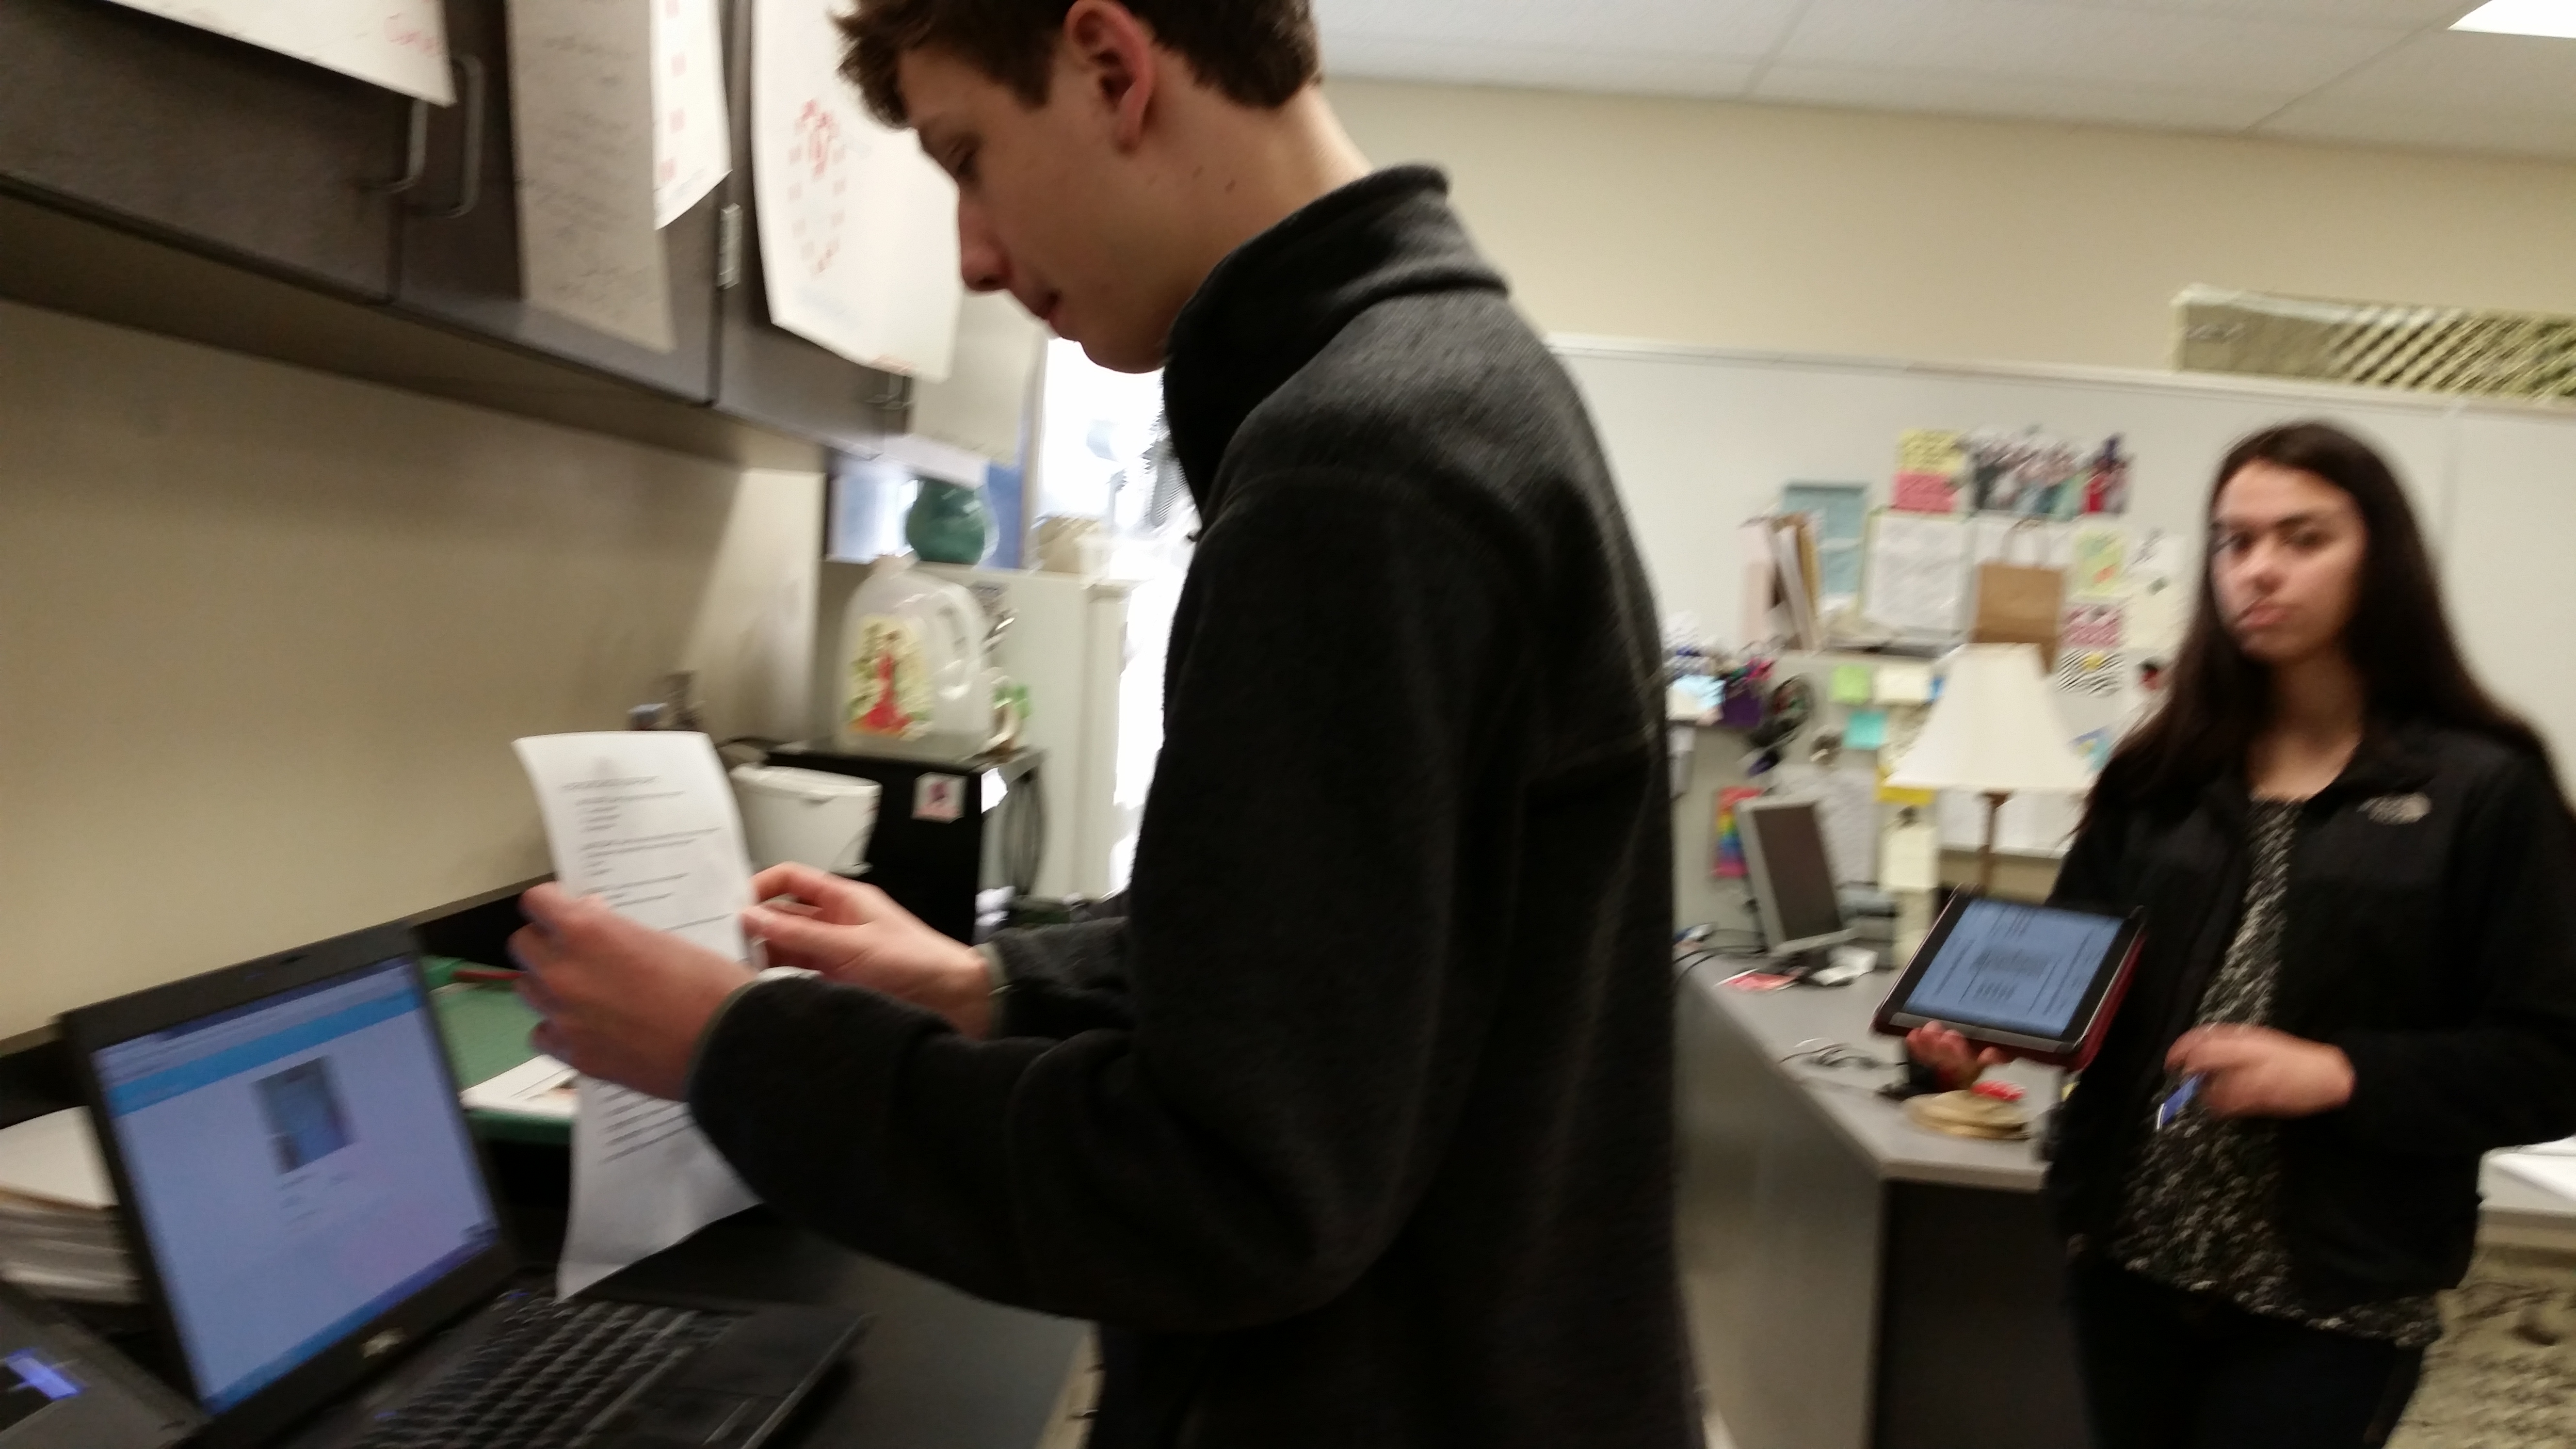
Students submitted both a physical copy and an electronic one.  I created groups of brochures with different topics and none created by a particular group member.

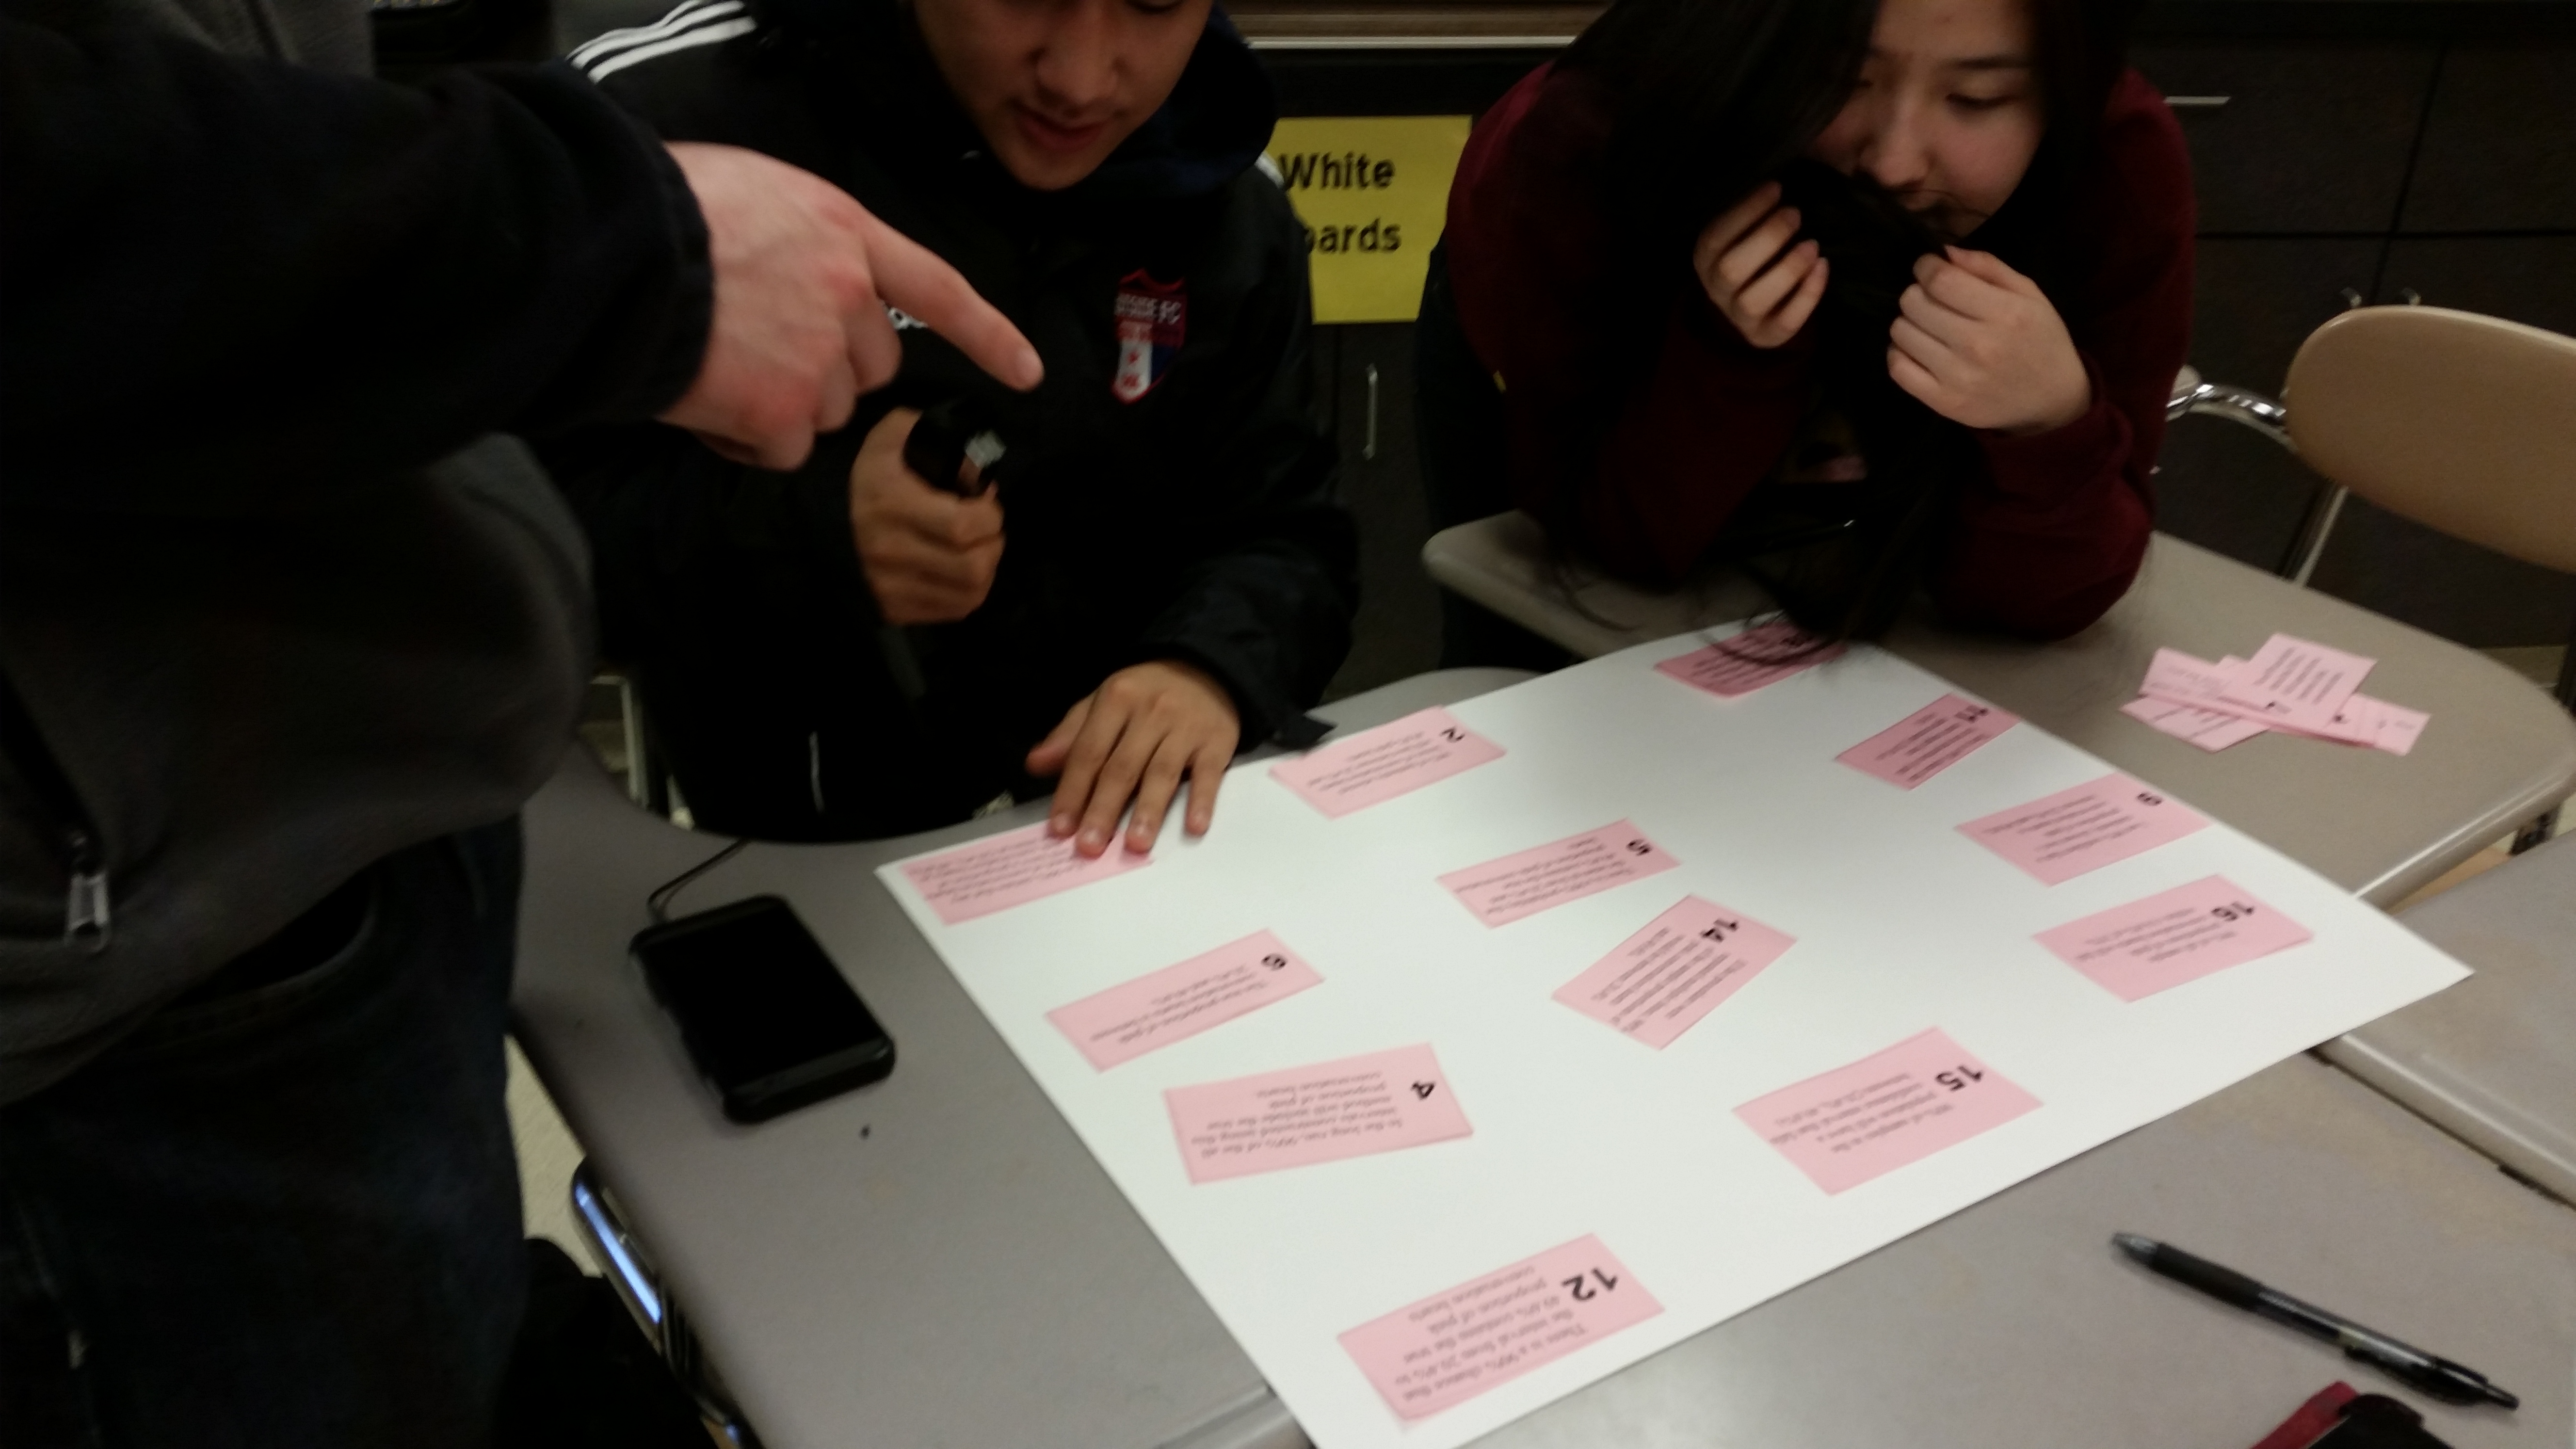
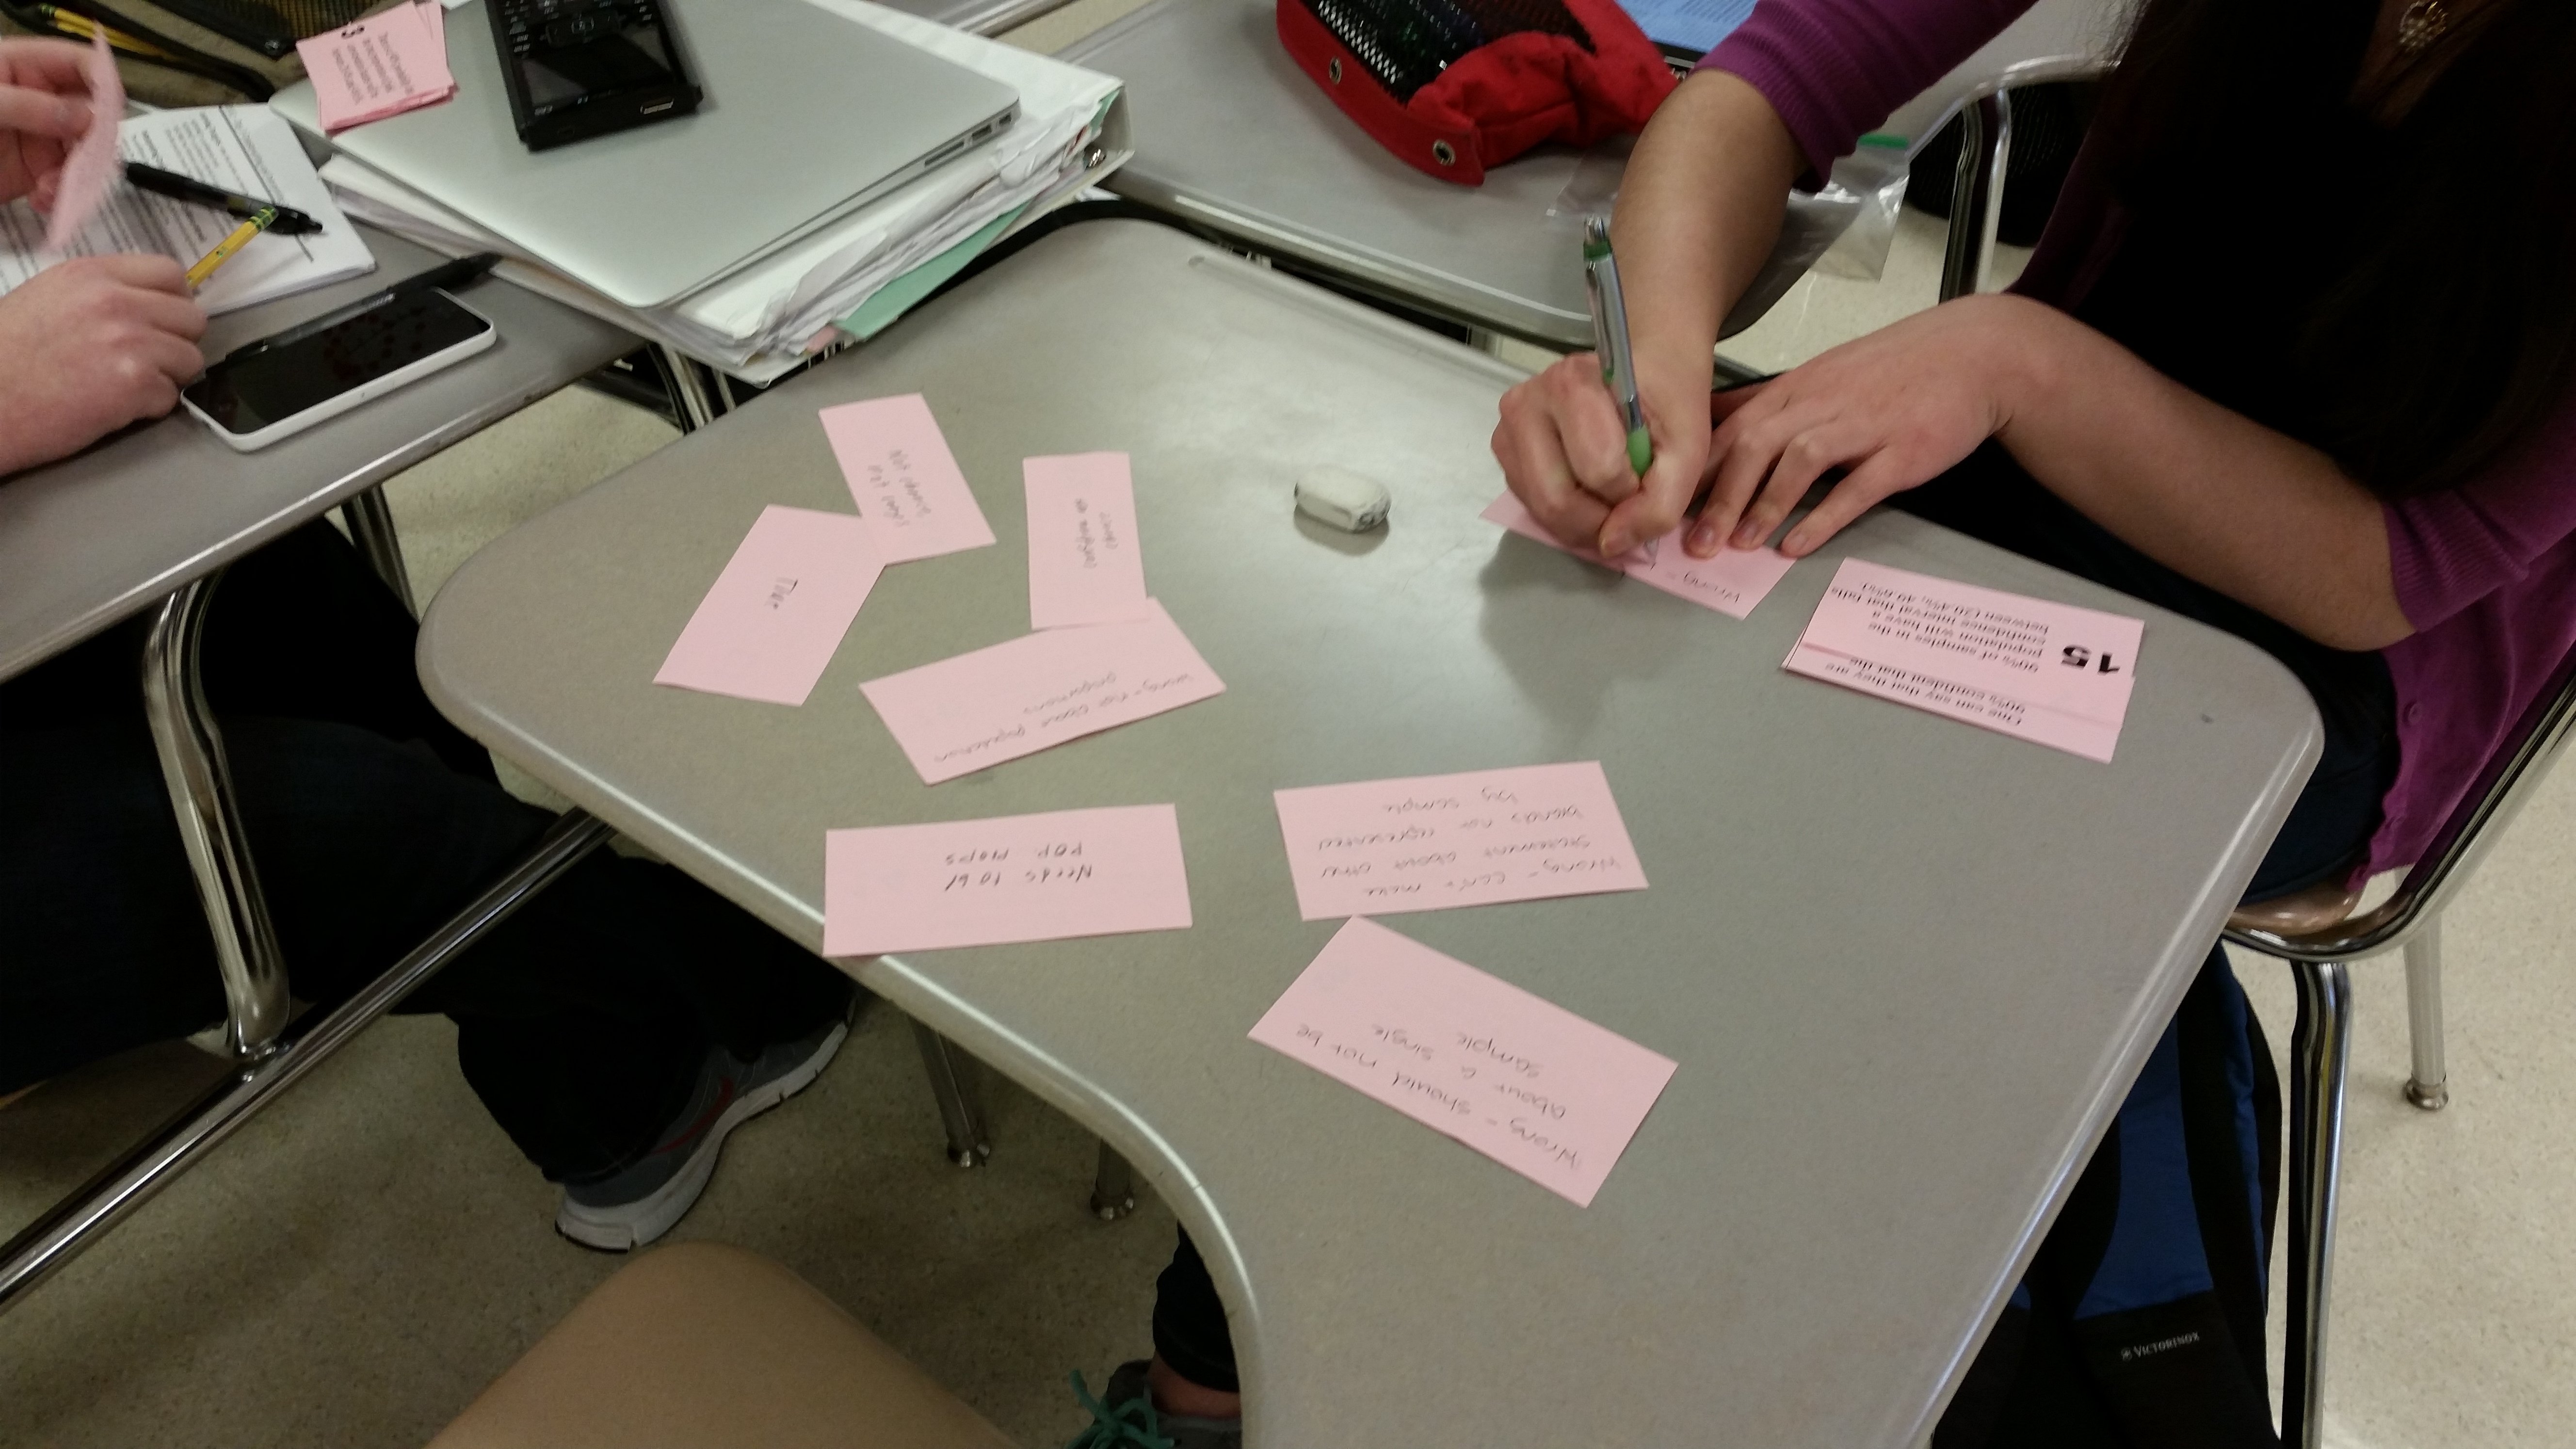
Today they did the peer review of the brochures, again using a Google Form.  I used radial buttons for the rubric part of the assessment. There was also a required comment section. I asked students to give both a positive comment about an intellectual aspect of the topic presentation and a constructive criticism. Part of their grade is their review of their peers and their peers’ review of their pamphlet.  You could have heard a pin drop.

20160223_123924 20160223_123348

We had 10 minutes left in class, so I tried something on the fly…never know how that will go. I asked the groups to discuss and determine the most interesting brochure. They then passed that one on to the next group.  I know  this will be part of the whole process next year.

Day 100: Getting Ready for T3 in Orlando

I am sooooo excited.  Once again I am heading to a Texas Instruments International Conference this year in Orlando, Flordia.  As a TI Regional Instructor, I’ve run enough week-end workshops, attended enough PDs and helped out in other ways to earn a free round-trip air fare and hotel lodging for the 5 days!  Since I will be presenting my Precalculus Folder Activity, I get a free registration!  Whoot-whoot!  I learn so much at these conferences. I think the T3 conferences have such great sessions and opportunities for collaboration with teachers from around the world as well as around the country. Love, love LOVE it!

20160222_173633 20160222_173638

The downside is prepping for a sub for 3 days.  In my precalculus classes, not so bad as I will have them complete a Mathematics of Finance packet where they explore Present and Future interest situations.  I usually have them do an online exploration of these rates by “shopping” for a home and then determining the going interest rate and their monthly payment.  Also have them “invest” in an annuity to see how much they can make over a given time period.  Since I won’t be there, I decided it would be too much for a “non-math” sub to handle.  The packet still gives them some interesting situations to explore.

AP Stats is a different situation!  They will have their test on confidence intervals on Wednesday, but then we are starting in on significance tests.  So many places to develop misconceptions even when I’m there. So I spent almost 2 days over our mid-winter break just prepping for my absence in stats.  I needed to re-write handouts and activities so my neo-statisticians could proceed without me.  I also hunted for videos that would accurately explain concepts like p-values and alpha-levels, processes like writing hypotheses, and the general rationale behing a significance test.  I think they will be in good virtual hands.

Day 99: Applying Technical Writing

Today we begin confidence interval for means in earnest in AP statistics. Yesterday after the activity, the students explored what a t-distribution was via this Geogebra document and looked at how to determine a critical t* value from a table as well as from the Nspire. (sidenote: although we do find values using tables occasionally, I emphasize using their calculator to find these values as well as the area probabilities…its all about saving time on the AP exam, so training them now will help them to be comfortable using their calculator later during all of the inference procedures).

Today, we did our first write-up of a t-interval for means, emphasizing the conditions that need to be met.  I am so glad that I “over-emphasize” these when they are learning about sampling distributions.  Of course, we write one up together so they understand what needs to be shown and stated in the inference procedure.

20160212_094732

As I’m writing this post, an idea popped into my head: a procedure wall!  Just like the word walls used in algebra and geometry classes but with the proper name of the procedure.  I’ll have a way to cover when they are taking an assessment.  I can use sentence strips, and maybe color-code for proportions vs. means vs. others.  Will have to ruminate on this a little more to flesh out the details…look for a future post on this!

Day 98: More CI Writing

So, yesterday, most of the groups got the statements sorted. Today they will create a poster of the incorrect statements and write underneath each one what the error is.  I found a great explanation by Bock about the types of interpretation errors with examples and explanations.  My students used this document to help guide them.  And they eventually were able to identify correct and incorrect statments, but also were able to articulate what made interpretations incorrect.  YAY!

20160210_082149 20160210_082757

Day 97: Technical Writing Practice

I’m sure you’ve never experienced this: things seemed to be going well until you assess, and then you find out you were in dream land!  That happened to me after the last mini-quiz I gave my AP statistics students on confidence intervals.  Although I gave them the sentence stems in their notes followed by whole class writing practice as well as individual practice, the assessment showed that they really didn’t know what they were talking about…no real surprise!

20160208_094424 20160210_081938

So I spent last night putting together a card sort on confidence interval statements around the Pink Sweetheart conversation heart activity.  I created 16 statements, some written correctly but using different wording, some incorrect, some based on the statements the kids wrote on their assessments.  They first had to read through the statements as a group.  Then they sorted into correct and incorrect statments. Thats as far as we got today.  More tomorrow…..

Day 95: MC Mondays

Late last year, via Twitter, a discussion revolved around how to give AP Stats students more and regular experience with multiple choice questions.  One idea put forth by @druink was to have an MC Monday experience.  She shared a form she created and asked for input and collaboration around the viability of the form: number of questions, student reflection, etc.

I wanted to use the form but tweak it some more to allow me to track both general student progress as well as progress in the four strands of the AP Stats curriculum: Exploring data, Generating data, Probability and Inference methods.  Part of this is to complete my teacher evaluation student growth component, but also to help me see if there are areas that need revisiting later in the course (of course, there always are, but in the past it was hit or miss rather than data driven).

One hindrance for tracking via components was how to identify each question easily so it didn’t become a time-suck.  In addition, I needed a reasonably easy way to generate questions that were essentially at the AP level. So my department purchased a new ExamView test generator for our text which already had the questions identified by the AP standards.  I also found that GradeCam can assign a learning target to questions. Unfortunately, the available targets were CCSS or state standards; luckily, in the CCSS there are “almost matching” statements around the 4 big strands, so I could label questions. Because I have been using GradeCam for unit tests as well as Midterms and Finals, students are very comfortable with the process of scanning their answers for me.

20160208_090734

So today was the first day of trying out the process and I think it went great!  Now I’ll be able to track long-term retention of the key ideas as well as monitor individual students’ growth (or lack there of).

20160208_090718

Day 94: Class Discourse Sparked by Navigator Quick Poll

One of the things I’d like to use more often in my Precalculus classes are multiple choice questions to promote class discussion.  Today as part of the opener I gave my first MC question.  Fairly straight forward question because I wanted to get the kiddos logged into the Nspire Navigator, which we haven’t done for a while.  The students wrote down on their Opener-Exit slip the answer along with any calculations they needed to do to determine the best choice. Then the Navigator, through a Quick Poll, collects their answers. Once I stop the poll,  I can project the responses in a bar chart.

20160204_110033

As you can see, there were two popular answers.  I asked my students in their groups to discuss their choices and try to determine which one was actually the correct answer along with supplying a reasoned argument for their group’s choice.  Some great conversations!  I then resent the Quick Poll to see if they could arrive at the correct answer without my confirming the answer.

Day 93: Be Mine Statistics

I’m a sucker for all things Valentine and hearts.  So why wouldn’t I have an AP Stats activity using Sweetheart conversation hearts?  This year, my students endulge me better than most, at least feinting enthusiasm for these corny activities.

20160205_084948

This activity was all about the proportion of pink hearts.  The big question was, “What is the true proportion of pink Sweetheart conversation hearts?”  They had to count the number of pink hearts and then determine a sample proportion for their box…we had to discuss our willingness to accept each box as a random sample from the population of all Sweetheart conversation hearts.

20160205_092227

From there, they began their introduction to inference methods via the confidence interval. Using their sample value, they explored the possible shape of the sampling distribution, how it related to their previous understanding of sampling distributions, what conditions might need to be in place, etc.

20160205_092217

The next step is to work on interpreting the confidence interval as well as the confidence level…their first foray into technical writing!

Day 92: Logistic Functions and Population Growth Modeling

This is the first day for my students in Precalculus for looking at logistic functions.  They completed an exploration from Foerster’s Precalculus book that had them look at a set of data points and then try to fit an exponential curve.  They quickly realize that the exponential is only accurate at the beginning of the data set.  They are then given the gene20160203_110557ral equation and asked to determine the missing coefficients from specified points using a system of equations.  Good discussions along with reviewing old concepts and processes used in new ways.

20160203_110613

One thing I’d like to do is create a graphic organizer to help explain (or have the students determine) what the various coefficients control.  Lately I have found more references online regarding this which didn’t seem available a few years ago.  Will have to share the websites at a later date