Monthly Archives: September 2015

Day 7: Frog Bands Data

I found these adorable little frog rubber bands this summer and knew I needed to have them to use with my AP stats kids. Although they are an elementary school manipulative, they seemed so fun for my high school kids! However, I didn’t anticipate the “brute force” of my HS students’ finger flinging, so a few of frog bands broke under the stress of being launched across the room. But the fun was well worth the tragedies.

20150918_162449 20150918_162532

I adjusted an Algebra 2 activity I found called Rubber Band Launch to use the Frog-bands. This is a fun 15-minute data collection activity required 10 datum.  The data is then used to develop the formula for the standard deviation.  It was really interesting to see how the students set up the data collection so the trials were as consistent as possible.  Prior to starting the activity, we talked about unintended bias and lurking variables that affect the consistency of the data values.

frog band 1 20150918_092536

How do you take a dry topic and spice it up with some quirky fun?

Day 6: Clothes Pin Posters


As I looked around my new fabulous room, I realized that I had little space to display student work. I racked my brain, checked out Pinterest, and did lots of Internet searches for ways to post work on my cupboards without using tape. I noticed that many elementary teachers who have cinder walls use Removable Mounting Putty made by Scotch. I was initially leery of the idea but I was desperate, so I gave the putty a shot. And you know what, it worked out great! As you can see, the putty holds up the large clothespins easily and they looked so fun in the center of each of the cabinets.

20150915_181127 20150915_181104

One of the most challenging thing to teach AP Statistics students (and actually any student) is how to write technically. So, early in the course, I start to have them write together. The activity today required the students to compare two sets of data. They were to practice using comparing language along with using all of the required elements to describe data (i.e SOCS, etc.). Using Google search under the image tab, I searched things like “comparing boxplots,” “comparing histograms,” and “comparing data sets.” I got some great graphs doing this! So I copied them, made them larger, cut them out and then my student groups randomly selected one of them. Here are the directions I gave the groups:

Comparing Distributions

Below are the final posters displayed wonderfully with my cabinet clothes pins!  Thank you elementary teachers for a practical and simple solution to my student display dilemma!

20150916_102734 20150916_102709

Day 5: Crop Dusting the 8 Practices

Last year I used the crop duster problem in my precalculus class as an introduction to the eight math practices. I was very happy with the results, and found that my students were able to identify the practices readily throughout the rest of the year.  After reflecting on the activity I decided I wanted to do some changes for this year.

One of the changes was to take away the coordinate axes in the picture , so the students had to think about how to impose a coordinate axes. We had a great discussion about various locations, discussing the pros and cons for each of those locations. Naturally the students decided to use the center of the circular field as the origin, but they were the ones that decided the location rather than being told.

A second change I wanted to do was to take away the questions. I didn’t want the students distracted by trying to solve the problem before the event understood what the situation entailed. Upon reflection, I wonder if I should also remove points P and Q. This would cause the students to realize at some point that they need those points labeled. Anyway, I gave them this information and picture:

Crop Duster Revisited

After giving them the picture, we took some time to look at the information and determine what was known. After brainstorm eight as much as we could, we then look for possible usable relationships inherent in the problem. They initially balked at the idea saying, “We don’t know what the question is, so how can we possibly come up with relationships?”  With a little prodding, they’ve really got into it. Here is a list of those brainstorms:

20150914_124123

The third change I wanted to incorporate was to have students generate possible questions rather than being told the questions. By having the students do this, I was asking them to use math practice 2: Contextualize the situation.

20150915_131044

Once we brainstormed the questions, we talked a little bit about how we would actually go about answering these questions. The really exciting part of this process is that once the students are given the questions they realize that they came up with most of them on their own AND had figured out how to go about solving the answer them. Awesome stuff!

What are some activities you have streamlined in order to get students to do more thinking and sense-making on their own without scaffolding?

Day 4: Looking at Multiple Representations in Statistics

This summer, during one of my lazy, meandering journeys on the internet, I came on a very interesting article by Malcolm Swan (MARS/Shell Centre at the University of Nottingham, England) called Designing a Multiple Representation Learning Experience in Secondary Algebra.  Here is the abstract from his paper:

This paper describes some of the research-based principles that I use when designing learning experiences to foster conceptual understanding. These principles are illustrated through the discussion of one type of experience: that of sorting multiple representations. I refer to learning experiences rather than tasks, because tasks are only one component of the design. Close attention is also paid to the role of the teacher in creating an appropriate climate for learning to take place.

Of particular interest to me was one of the activities called Frequency graphs, Cumulative frequency graphs and Box and whisker plots.  I always like having matching activities to get my students talking to each other. This one seemed like the great higher level matching activity good for the first chapter in our textbook.  I plan to use this task after our discussion of ogives.

20150911_152853 20150911_152858

Today, I xeroxed and laminated the task cards and plan to use them early next week. Be sure to check in next week to see how the activity worked out.

Whoo-hoo, it’s Friday and gorgeous-sunny outside.  Perfect day to get outside with my dog.  Had a good first week, especially with my kiddos!  Technology was (actually continues to be) a challenge, but the week-end will help me decompress. How did your first week back at school go for you?


Day 3: Mindset Questionnaire

Mindset bookI had a long time reading list for this summer and I’m proud to say that I got many of those books read!  A colleague of mine here at school and I read Carrol Dweck’s Mindset: The New Psychology of Success together. Basically we did a mini book club and we had some great discussions afterwards. I even got a chance to practice my do little note taking (but that’s for another post later this year).

20150910_172906 evOne of the things we wanted to do at the beginning of the year was tried to assess where our kids were on the mindset scale. We found a great questionnaire on growthmindsetmaths.com, that we of course tweaked a little bit. What was nice about this questionnaire is it is heavily based on math attitudes and it also had a rating scale!  Score!!  Check out the site because there are a lot of other really useful materials.

So anyway today, I gave the questionnaire two my PRECALCULUS classes and then they used grade can too quickly scan their results. It worked like a charm! And my students were quite impressed with getting results so quickly. Something to be said for immediate feedback. Below is a picture of the screen as I was standing one of the students questionnaires. The second screen shot is an item analysis of student responses to each of the questions. The green bar is the answer with the highest growth mindset rating.The bar immediately to the left or the right is also a positive growth mindset response although not as strong.  Although I have not finished analyzing where my students’ average mindset lands on this scale, it is quite interesting to look at the data.

GradeCam GradeCam2

Tomorrow, I will have my students find their overall mindset score using the weighting scale for each question.  Then we will create a dot plot of the results. That will give me a clearer picture of where the class lies on the mindset scale. I hope to use this information to help kids move more words eight growth mindset in their mathematical studies.

How have you used the idea of growth mindset to help your students take risks and persevere in their learning? What activities have been successful for you?

Day 2: Summer Review Stations

Over the last few years I have assigned to my AP Statistics students a summer work packet. Thanks to Joel Evans, I got some great ideas for Topics for the students to explore and how the to use google docs to collect my new students’ survey and results . However when they came back to school, I didn’t have a good way to assess what they knew and didn’t know from the summer experience. Also I had not been very successful using the student data I collected throughout the year. You know how things go, as the year progresses you get bogged down in the everyday and lose sight of your best summer intentions.

Since we started classes the day after Labor Day, which is a week later than usual, we were already a week behind last year’s schedule before we even started because the AP exam is essentially on the same day this year, May 12th. How was I going to make up a week of time without telling the kids off and the first week? I knew I needed to do something that was engaging and yet covered essential topics they would need for the AP exam. That being said I really wanted to do something different this year. Learning stations worked so nicely last year, and my students indicated in their end of year evaluation, that they liked the review stations a lot. I thought stations would be a good way to introduce students to each other and to get them talking about statistics and data right away.

I spent some time looking at what was in the first chapter that have already been covered in the summer work and correlated the two. Then I divided those topics into 8 stations. Initially, I thought it would be fun for my students to do some data collection activities. But right away I decided it would be too much too soon. I also realize I wanted to use their summers survey results. So, instead, I created activities around each of those 8 topics that would also use their survey results as much as possible.  Since we don’t have the technology ready yet (that is, everyone having an iPad ready) I made answer packets for the students to record their answers.

I also copied the Summer Survey Results on the back of the AP allowed formulas that we use first semester and had them put in a plastic sleeve.  We had a nice discussion about how data is recorded and how statisticians, dispite their best efforts, get “junk” results…since some of the student results were unexpected.  Now I hope I will use that data more readily.

20150909_090744 20150909_090834

I was really excited to try the stations out.  As you can see, I believe the activity was a great success! Since we have shortened class periods this week, it will take my students three days to get through the eight stations.  ID them 15 minutes per station and used Online Stopwatch projected at the front of the room to keep the groups focused.  I just loved (and was happily amazed at) the student dialogue, how they filled in missing ideas for each other and the questions my kiddos asked each other and me.  I believe it is going to be a great year!

I have to say this was one of the most successful and engaging ways to start my AP statistics course!  What did you do to get your kids and just stop and engaged in your first week?

Day 1: We’ve Started!

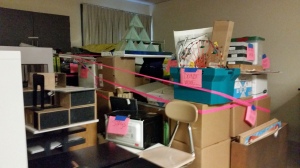
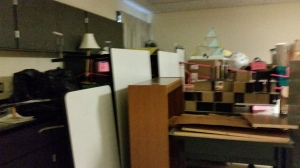
Gosh, It’s hard to believe that the summary is over and it’s time to start teaching again. A couple of weeks ago I didn’t think I would get on pat and get my room set up in time. You can see from the photos how much stuff I had to unpack.  I’m pretty satisfied with the final product. I just loved having my classroom set up and organize, don’t you? Can you believe all the junk I had two on impact and organize? Thank goodness this as a science room with lots and lots of cabinets and drawers!20150630_07323220150630_073239

Here are before and after pictures of the front of the room. I hope you can see what a difference decorating can make. I decided I wanted to have my kids in groups most of the time, but they didn’t want to have that big tables I had in my last room. So I asked for individual desks and then send them up in groups of four. I went Dollar Store and got furniture pads to put on the bottom of each of the desk legs so that when they move around, they don’t make that awful scraping sound. I also used some of Sarah Hagan’s free posters that she shares at math equals love.20150630_07324320150908_172713

I’m also pretty happy with my teaching area in the back corner of the room. My school district installed three whiteboards at the back of the classroom. I am really thankful for that! I’m still puzzling about how to post students work. In my previous classroom I had a magnetic whiteboards, so I could use magnetic clips to hold the work of. In this around I don’t have that luxury. I have lots of cabinets but I hate to think of putting tape on them ‘cuz it leaves a residue that is hard to clean. And the blue painters tape just doesn’t stand for any length of time. Does anyone have a good suggestion?

20150908_172735

How did your first day of school go? Does anyone have a great story to share?